


Tirupati SDI
This page aims to present the key spatial datasets that provide insights into how Tirupati has grown as a city and how its urban form interacts with climate and energy dynamics. The data covers changes in Land Use, Population Density, NDBI, Road Network, Land Surface Temperature, and Energy Use Intensity (EUI). Together, these layers help us understand the link between urbanization, land transformation, and environmental performance. The datasets are developed as part of the research initiative:
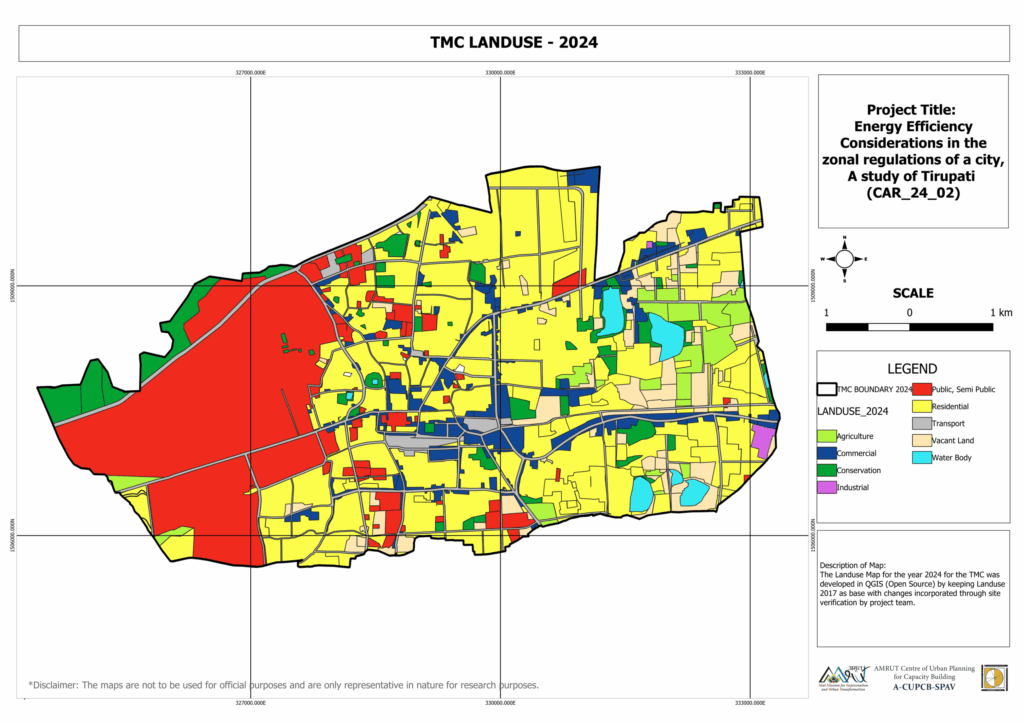
“Energy Efficiency Considerations in the Zonal Regulations of a city, A study of Tirupati (CAR_24_02)” For more details, click here.
Tirupati, located in the south-eastern part of Andhra Pradesh, serves as both a prominent pilgrimage center and the district headquarters of Tirupati District. The district, officially carved out of the erstwhile Chittoor District in April 2022, extends across an area of about 8,229 square kilometers, representing 5.05 percent of the state’s geographical area. Geographically, it lies between latitudes 13°21′54″ N and 14°8′32″ N, and longitudes 79°5′42″ E and 80°4′10″ E, bordered by the Bay of Bengal to the east, SPSR Nellore and Annamayya districts to the north, Annamayya and Chittoor districts to the west, and Chittoor district along with Tamil Nadu to the south. Administratively, the district is divided into four revenue divisions, six municipalities, and 774-gram panchayats, with a population of around 2.2 million people distributed across 1,051 villages.
The city of Tirupati has grown well beyond its origins as a temple-town, developing into a tier-2 urban hub with expanding economic and social functions. According to the 2011 Census, the municipal population was approximately 287,000, while the urban agglomeration stood at nearly 460,000, making it one of the largest urban centers in Andhra Pradesh. Its status as the district headquarters has further consolidated its importance as an administrative and service node. Recognized under the Smart Cities Mission, Tirupati has been earmarked for sustainable infrastructure development, and in 2012–13, it was awarded Best Heritage City by the Ministry of Tourism, Government of India.
Culturally, Tirupati is often described as the spiritual capital of Andhra Pradesh, owing to the global prominence of the Sri Venkateswara Temple at Tirumala, one of the world’s most visited religious shrines. The temple, situated atop the sacred Tirumala Hills, has a long history of patronage from the Pallava, Chola, and Vijayanagara dynasties. The administration of the temple and associated religious institutions falls under the Tirumala Tirupati Devasthanams (TTD), a statutory trust established in 1932, which employs nearly 16,000 staff and oversees pilgrim management, amenities, education, and cultural promotion.
In addition to its religious significance, Tirupati also offers a range of natural and cultural attractions, including Sri Venkateswara National Park, Talakona Waterfalls, the Silathoranam rock formation, Chandragiri Fort, and Govindaraja Swamy Temple. The district’s economy is diversified, with agriculture, services, and education playing vital roles. Climatically, Tirupati experiences a tropical monsoon climate, characterized by very hot summers often exceeding 42°C, mild winters, and annual rainfall of about 900–1,000 mm. Its strategic position at the foothills of the Eastern Ghats makes it a unique site where ecology, culture, and rapid urbanization intersect, underscoring its importance for climate-sensitive urban planning and sustainable growth. In summary, Tirupati represents a dynamic blend of heritage, spirituality, and modern urban growth, reflecting its importance as one of Andhra Pradesh’s most significant cities.
Tirupati SDI Components
A ward boundary map shows the legally defined administrative divisions within a municipal corporation, used for governance, electoral representation, taxation, and local planning. (MoHUA, 2015)
Land use maps classify the spatial distribution of human activities and natural features, such as residential, commercial, industrial, institutional, agricultural, and open spaces. They are essential for understanding urban growth patterns and guiding sustainable planning. (Anderson, Hardy, Roach, & Witmer, 1976)
A road network map illustrates the layout and classification of roads, such as arterial, sub-arterial, collector, and local streets, and is critical for evaluating connectivity and mobility patterns. (Indian Roads Congress [IRC], 2018)
Population density maps display the number of people living per unit area (e.g., persons per sq km), highlighting variations across wards or neighbourhoods. These maps are vital for infrastructure planning and identifying high-pressure zones in cities. (Census of India, 2011)
The Normalized Difference Built-up Index (NDBI) is a remote sensing index derived from satellite imagery that emphasizes built-up areas by contrasting shortwave infrared (SWIR) and near-infrared (NIR) reflectance. (Zha, Gao, & Ni, 2003)
Land Surface Temperature (LST) represents the radiative skin temperature of the land surface as measured by thermal infrared sensors, and is widely used to study urban heat island effects and environmental impacts of land use change. (Weng, 2009)
Energy Use Intensity (EUI) measures the amount of energy consumed per unit of built-up area (kWh/m²/year), and is a key indicator for assessing spatial variations in energy demand and efficiency. (U.S. Department of Energy [DOE], 2015)