


Machilipatnam SDI
This page aims to bring to you certain spatial data that can help us understand how Machilipatnam functions as a coastal city and how its natural and built environment interact to shape flood vulnerability. The data highlights the topography, drainage density, natural stream order, contour variations, and road network, which together determine the flow of water across the city. Elevated ridges and low-lying pockets are particularly important for identifying zones prone to frequent inundation. By analyzing drainage channels and urban morphology, one can trace how water navigates through built-up areas, road corridors, and natural streams, offering crucial insights into the city’s flood-prone landscapes. This data is developed for the purpose of the research project titled “Urban Blue-Green Infrastructure Toolkit for Enhanced Resilience Towards Urban Flooding: The Case of Machilipatnam (TUR_24_03)” – for more details of which, click here.
Machilipatnam, historically known as Masulipatnam, is a coastal city and the administrative headquarters of Krishna District in Andhra Pradesh, India. Located on the Coromandel Coast along the Bay of Bengal, the city has been a prominent port since the medieval period, playing a central role in Indo-European maritime trade. Its strategic location at the mouth of the Krishna River estuary gives it a distinctive physiographic setting, where deltaic plains meet tidal backwaters. The terrain is generally low-lying, with elevations ranging from 0 to 14 meters above mean sea level, making it highly susceptible to storm surges and coastal flooding (APSDMA, 2022). The road network integrates national highways, regional linkages, and urban streets, but often intersects with natural drainage courses, intensifying flood risks during heavy monsoonal rains and cyclonic events.
Climatically, Machilipatnam experiences a tropical wet and dry climate, with hot summers where maximum temperatures often exceed 40°C, and moderate winters averaging around 20°C. The southwest monsoon (June–September) contributes the majority of its annual rainfall of about 1,000 mm, though the city is equally vulnerable to northeast monsoon depressions and cyclones. Its coastal location has historically exposed it to devastating storm events such as the 1977 Andhra cyclone. These conditions make sustainable drainage, green infrastructure integration, and flood-resilient planning essential to safeguard livelihoods and infrastructure.
Economically, Machilipatnam retains its heritage as a port city, with fisheries, handloom weaving (notably the famed Kalamkari textiles), and salt production as traditional industries. While the old port has declined in prominence, plans for a modern deep-water port continue to shape its economic aspirations. The city’s urban fabric blends historic bazaars, residential clusters, and expanding modern developments, but unplanned growth in low-lying zones has heightened its flood exposure. Machilipatnam’s cultural richness, coupled with its strategic coastal location, underlines the urgent need for integrated blue-green infrastructure interventions to enhance resilience against urban flooding.
Machilipatnam SDI Components
A road network map illustrates the hierarchy and connectivity of urban and regional roads, including arterial, sub-arterial, collector, and local roads. It provides insights into accessibility, mobility patterns, and transport planning, helping to evaluate infrastructure capacity and traffic distribution. (Indian Roads Congress, 2014; Ministry of Road Transport & Highways, 2020)
Elevation and contour maps depict the topographic variation of a region, highlighting elevated ridges and low-lying depressions. Such data are crucial for flood risk analysis, site suitability, and urban infrastructure planning. Contour intervals further support understanding of slope gradients and watershed boundaries. (USGS, 2007; Survey of India, 2022)
Slope maps represent the rate of change of elevation over a given distance, categorizing land into flat, gentle, moderate, or steep terrains. They are widely used in flood modeling, drainage planning, and land suitability analysis. (FAO, 1990; NRSC, 2021)
Soil maps provide spatial information on soil types, textures, and characteristics such as permeability and fertility. They are important for agriculture, construction suitability, and hydrological studies. Understanding soil composition aids in identifying flood-prone areas and groundwater recharge potential. (NBSS&LUP, ICAR, 2019; USDA, 2017)
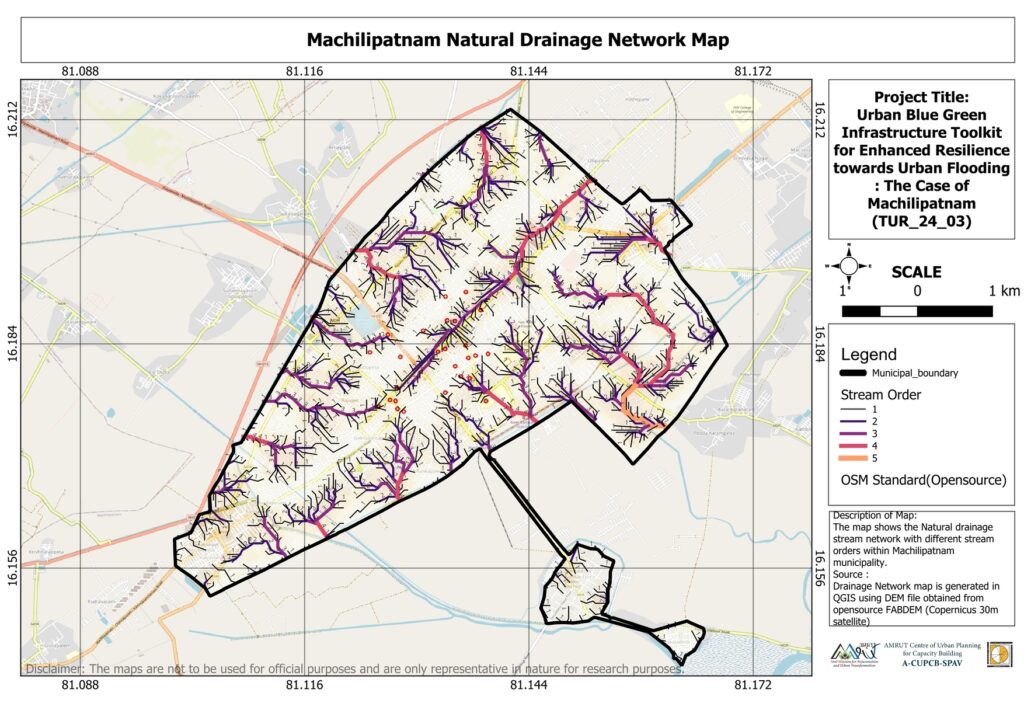
Drainage density and stream order maps represent the spatial arrangement and connectivity of natural streams and channels. Drainage density indicates how well an area is drained, while stream order classification (Strahler’s method) helps analyze hydrological response and flood susceptibility. These layers are critical for watershed management and flood mitigation planning. (Strahler, 1957; Horton, 1945)